
. . . over Brexit. But I'm not convinced that this is the earth-shaking moment some seem to think.
Sure, it may mark a sea-change in the evolution towards larger polities. But I have always been skeptical of that movement. I have always wanted to see us evolve back towards city-states.
Gold had a nice move, but I'm always suspicious of moves that are tied to political/economic events. They tend to reverse quickly once everyone realizes that the world isn't going to end. Additionally, over the past decade, sharp moves tend to be in opposition to long-term trends. When the fast moves are down, that seems to happen when the long-term trend is upward. Sharp upward moves in the gold price were common in the late 90s, at a time when the long-term trend was still downward.
So, let's see how yesterday's close looks on our long-term graph of USDX vs gold.
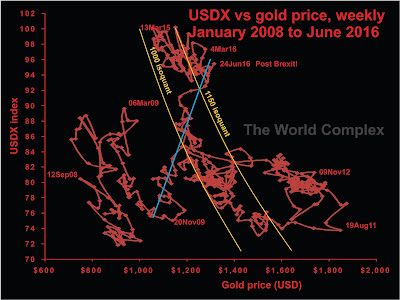
This is a straight graph of the US dollar index vs the gold price. If gold simply moved in opposition to the dollar, then the graph would trace out a single isoquant (one of the yellow hyperbolae). In truth, while the graph does follow isoquants fairly often, there are also shifts from one isoquant to another, sometimes involving moves in which both the gold price and the US dollar index rise together (the blue trend line).
I have interpreted the movement along the blue line as a signal of deflation (provided we are moving toward the upper right). In the past several years, there have been two distinct pulses along the blue line - from late 2009 to mid-2010; and the last four months or so of 2014. I have been expecting a resumption of the impossible trend for some time. Yesterday's close does give us a one-week move in this direction, but we would need to see at least a couple of months of follow-through before identifying another deflationary impulse.
Last week's move is small compared to the movement along the blue trend in 2010.
In the reconstructed phase space portrait of the product of the gold price and the dollar index, Brexit looks like it may have forced a move out of an area of attracted that the system has been occupying for the last three years.

There have been little pop-ups like this at different times during the last three years, and none of them have stuck. The last time we had a break-out from this zone of attraction was in late 2011, culminating in the move in the gold price through $1800. Given the number of times the system has threatened to break out without doing so, we still need to wait and see.
No comments:
Post a Comment