
. . . an inverse head-and-shoulders forming on the chart below? We may just be finishing the extreme low of the right shoulder.

If the neckline is regained, the pattern points to a measured move to close to the 1300 level, which will be close to where we were before the meltdown in gold last spring.
I have used Gold x USDX index as a parameter in the past. My thinking is that this product reflects the value of the product of gold mines to companies which are not operating in the US.
For context, some of our happiest times investing in gold miners occur when this index rises.
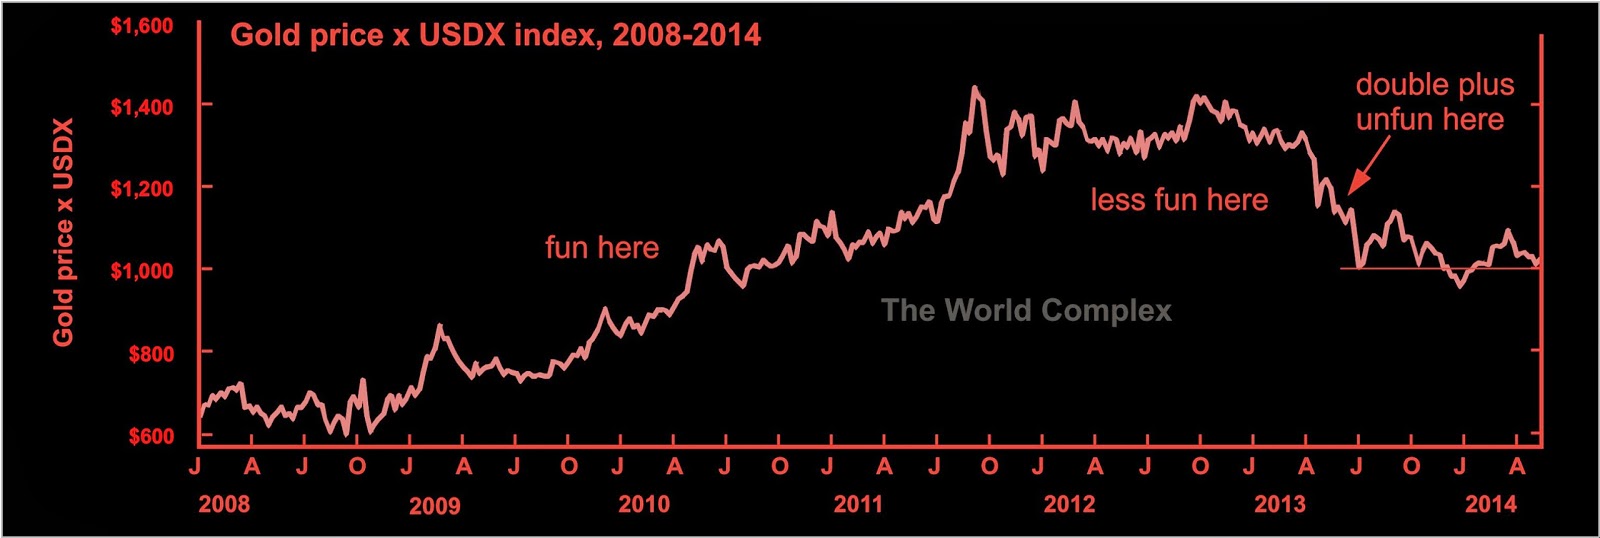
I've also marked what looks to me to be an increasingly important line in the sand at the 1000 level. I'd hate to see this line get broken.
If the neckline is regained, the pattern points to a measured move to close to the 1300 level, which will be close to where we were before the meltdown in gold last spring.
I have used Gold x USDX index as a parameter in the past. My thinking is that this product reflects the value of the product of gold mines to companies which are not operating in the US.
For context, some of our happiest times investing in gold miners occur when this index rises.
I've also marked what looks to me to be an increasingly important line in the sand at the 1000 level. I'd hate to see this line get broken.
Coming here and reading "doubleplus" just after finishing a re-read of 1984 is a little spooky.
ReplyDeleteYou shouldn't have read it in front of the telescreen then.
DeleteThe pattern could also be a pennant.
ReplyDeleteIf there's not high volume on the right shoulder it's not a true H&S. Ideally the right shoulder has high volume and is very short in time compared to the left shoulder.
Really what you're doing is hoping we print a higher high from the right peak, which would suggest the possibility of an uptrend forming. Cos by definition we're still in a downtrend on that chart.